In this section, I discuss various solutions and technologies that can help assist the transition to a fully decarbonized power grid. Some are targeted at fixing intermittency or seasonality issues; some are targeted at increasing the amount of carbon-free power on the grid. None are silver bullets, and any zero-carbon system will likely involve all of the technologies mentioned (in addition to others that are either novel or unforeseen).
2.1 Battery Energy Storage Systems
Solving the intermittency problem will, at some level, require energy storage systems to store electricity when production is abundant (and market prices are cheap) and release it back to the grid when production runs low (and market prices rise again). Numerous different technologies exist for this purpose, with different technologies being more suited for different scales of energy storage and power capacity: pumped hydro storage (e.g. a dam) works well for large-scale, longer-period applications requiring the capability to store hundreds of megawatt-hours of energy and to discharge at a rate of hundreds of megawatts for several hours. Flywheels are used to provide grid stability, due to their low energy storage capacities (often measured in seconds) but high ability to release power (often from ten to hundreds of kilowatts). Batteries of various chemistries occupy the space in between, with systems often being able to release megawatts of power for a few hours [i]. Note, however, that storage on the scale of hours helps with intermittency only – batteries are unlikely to become economically viable for solving the seasonality issue. As of 11/17/2020, the US had 24.5 GW of power capacity deployed for all types of energy storage systems, over 90% of which came from pumped hydro storage [ii].
The 2010s saw an explosion in the prevalence of battery energy storage systems (BESS) in particular, growing from 7 systems with 59 MW of power capacity in 2010 [iii] to 100-plus systems, 1+ GW of power capacity and 1+ GWh of energy capacity in 2019 [iv]. Lithium-ion batteries have been the dominant chemistry, accounting for over 90% of installed battery power capacity. Deploying large-scale battery installations to support the grid has become increasingly common, with a few notable examples. The Hornsdale Power Reserve in Australia was deployed in 2017 with 129 MWh of energy capacity and 100 MW of power capacity, making it the world’s largest battery installation at the time. The company claims to have saved South Australia consumers AUS $150M in the first two years [v], while the project was estimated to have cost AUS $90M [vi]. In December 2020, California’s Moss Landing system came online, with 300 MW of power capacity and 1,200 MWh of energy capacity [1][vii]. That dominance has been driven by rapidly declining costs: the capacity-weighted cost of utility-scale BESS systems dropped 71% from over $2,000 to $625/kWh just from 2015 to 2018 alone [viii]. Further cost improvements are incredibly likely, as lithium-ion technology benefits from R&D dollars in parallel industries (e.g. consumer electronics, electric vehicles, etc.): Bloomberg finds that the cost of automotive batteries at a pack-level [2] reached an average of $137/kWh toward the end of 2020 [ix]. While automotive batteries and grid-storage batteries may be somewhat different [3], tracking the cost of an electric vehicle battery serves as a valuable proxy for grid storage battery costs.

Figure 10: Historic Li-ion Battery Pack Prices [x]
BESS systems are incredible assets to the grid, beyond just the umbrella term of “energy storage”. Intuitively, by charging when power is cheapest (which usually aligns with when renewables are producing the most power) and discharging when power demand is most higher (which usually aligns when the grid is using higher-cost sources), they can reduce the curtailment of renewables (i.e. renewable electricity being “wasted”). Batteries are also valuable for providing operating reserves (i.e. providing a small buffer to ensure supply-and-demand matching on a per-second basis), and black start capabilities (providing the initial source of power for a larger generator to get up-and-running). Batteries can defer [4] costly infrastructure upgrades by acting as substitutes for peaking generators that are only rarely used each year, or reduce them when paired with a VRE source [5][xi].
The variety of benefits conferred by grid storage, combined with declining costs, are driving rapid future growth in the BESS market. The US Dept. of Energy forecasts global grid-related energy storage deployments to grow at a 27% CAGR [6], which annual deployments in North America in 2030 reaching 41,100 MWh [xii].
Nevertheless, batteries will not alone act as a silver bullet to transitioning to a zero-carbon power grid. Cebulla et al. [xiii] conducted a study of studies and found that as VRE occupied a greater share of the generation market, storage requirements increased linearly for power capacity (kW) and exponentially for energy capacity (kWh), which in turn implies an exponential increase in cost. Furthermore, they found that the type of VRE mattered – solar-heavy systems required far more grid storage than did wind-heavy systems [7], and wind-heavy systems required far more deployment of transmission lines. Likewise, MacDonald et al. [xiv] found that solving the intermittency problem could be done more cost-effectively by favoring new transmission lines over new grid storage. Essentially, the argument is that you don't need as many batteries if you can add lots of geographic variability in the mix: even if the wind is blowing a lot in one region and very little in another, on average the sum total across the country should be more smooth.
2.2 Hydrogen: An Alternative Method for Energy Storage
While battery storage can help solve the intermittency problem on the scale of hours, it does relatively little to solve the seasonality issue: at the end of the day, the cost to build out months of energy storage capacity would be prohibitively expensive [8]. Hydrogen represents a possible option for long-term, grid-scale energy storage. This is a point worth stressing, due to popular misconception: hydrogen is merely a means of energy storage; it isn’t an energy source in and of itself [9]. Hydrogen can be produced via several methods, including electrolysis (in which electricity is used to split water molecules into elemental hydrogen and oxygen) and steam methane reforming (SMR), in which water and methane from natural gas is used to generate hydrogen and carbon dioxide [10]. In either scenario, the energy from other sources (electricity or natural gas) is being stored as hydrogen. Hydrogen produced via electrolysis using renewable electricity (e.g. from solar, wind, etc.) is termed “green” hydrogen, whereas hydrogen produced using SMR is “grey” hydrogen, due to the carbon dioxide emissions. If SMR is paired with carbon capture, the result is “blue” hydrogen. Hydrogen can also be produced through a process involving coal, which can be referred to as either “grey” or “brown” hydrogen [xv]. As far as emissions go, a zero-carbon energy system is theoretically indifferent between blue and green hydrogen [11].
Production of hydrogen, unfortunately, is quite expensive and hasn’t reached a large scale yet. A kilogram of hydrogen contains roughly as much energy as a gallon of gasoline [xvi] at 33.6 kWh [xvii], and producing green hydrogen costs roughly $3-8/kg [xviii]. In contrast, grey hydrogen can cost closer to $1-2/kg, while blue adds the cost of carbon capture (discussed in Section 2.7) to bring the bill to $1.50-3/kg [xix]. Overall hydrogen demand stood at roughly 74 megatons [12] of H2 in 2018, mostly driven by the oil refining and ammonia sectors [xx]. Meanwhile, blue-plus-green hydrogen production has held steady at 0.36 megatons annually from 2015 through 2019. Green hydrogen is expected to begin ramping up: based on announced project timelines, the IEA expects the installation of electrolyzers (which perform electrolysis) to grow at a rate of 90% annually between 2019 and 2023, from 25 MW to just under 1500 MW [13]. This will enable blue-plus-green hydrogen production to grow to 1.45 megatons annually in 2023 [xxi].

Figure 11: Annual Installed Capacity of Electrolyzers [xxii]
Production, however, is just one piece of the puzzle: hydrogen adoption also depends on the cost and scalability of storage and transportation infrastructure, which currently are quite expensive. Beginning with storage, at optimal usage levels, the capital cost of building out storage infrastructure could be spread out to achieve low costs per unit of hydrogen: approximately $0.19/kg using pressurized containers. However, pressurized containers are best suited for small-scale use, with length of storage ideally measured in days. Long-term seasonal storage at large scales would best be served by storing hydrogen in depleted gas fields, though the geographic availability of this fields is limited, and costs per kg are 10x higher than for pressurized containers (since the reduced cycling rate implies a smaller base to spread out capital costs). Various methods of storage are compared in the table below, along with their levelized cost of storage (i.e. including both operational and upfront capital costs):

Figure 12: Comparison of Hydrogen Storage Methods [xxiii]
On the transmission side, costs for large-scale transmission are approximately $0.58/kg, again assuming optimal usage [14][xxiv]. The table below lists levelized costs (in dollars per kilogram, as of 2019) for the transmission of hydrogen at various scales and distances:

Figure 13: Cost of Ideal Hydrogen Transportation Methods, by Distance and Volume [xxv]
However, hydrogen is often incompatible with existing pipelines and storage containers, requiring all new infrastructure – BloombergNEF estimates a total of $637 billion in investment by 2050 for hydrogen to replace natural gas [xxvi]. With current levels of utilization, the solution to hydrogen’s chicken-and-egg problem isn’t apparent, and operating infrastructure at reducing capacity requires capital expenditures to be spread out over a smaller base. As mentioned previously, batteries have benefitted enormously from R&D spending from industries beyond grid electricity storage. Hydrogen also benefits somewhat from development from heavy industries such as oil refining and ammonia production, but ultimately these R&D externalities won’t come from the same industries: at least in transportation, for example, hydrogen fuel-cell cars are off to a much slower start than battery electric vehicles, with under 10,000 cumulative US sales at the end of 2020 [xxvii], and under 7,000 global sales from January to September of 2020 [xxviii]. In contrast, Tesla sold over 440,000 combined Model 3’s and Model Y’s during 2020 [xxix]. This in turn means that the transportation industry won’t be a strong source of R&D efforts – instead, hydrogen R&D will (likely) be driven by aviation, shipping, and heavy industry [15].
In terms of using hydrogen to generate electricity, efficiency is lower compared to batteries. Tesla’s Powerpack boasts an 89.5% round-trip efficiency [16][xxx], whereas overall system efficiency of using hydrogen as an energy storage device for the grid is closer to 40% [xxxi]: first, electricity runs an electrolyzer, and then a hydrogen fuel cell or hydrogen-fueled gas turbine converts the hydrogen to electricity. Both processes have inefficiencies: the theoretical limit for electrolysis is 83% efficiency [17][xxxii], while fuel cells and turbines are around 60% efficient [xxxiii]. Therefore, unless building hydrogen capacity becomes much cheaper than batteries, batteries represent a more attractive value proposition for grid storage, at least in terms of storage on the scale of hours [18]. However, when the duration of storage increases to weeks or months (i.e. at the scale required to address seasonality), hydrogen is incredibly promising. Returning to the table above, salt caverns and depleted gas fields are able to storage incredible quantities of hydrogen, for incredibly little capital cost: even at today’s cost of $1.90/kg, total storage costs are roughly around 9.42 cents/kWh of electricity produced [19]. In contrast, even using 2030 cost estimates for batteries [20], trying to build batteries for seasonality purposes would require roughly 36 cycles to break even [21], well outside of the realm of seasonality [22]. Hydrogen-fueled gas turbines (essentially, natural gas power plants that are capable of using hydrogen as fuel) are already being built today at a capital cost of (at least [23]) $914 per kW of generation capacity [xxxiv], roughly on par with standard combined-cycle natural gas plants [xxxv]. Fuel cells are currently more expensive, at $6,700/kW of generation capacity [xxxvi], though cost declines are likely to come quickly for any nascent technology.
2.3 Expanding Transmission Networks
Energy storage, which involves shifting production across time, is costly. Shifting production across space – by expanding the transmission network to enable efficient long-distance, high-volume electricity transport may help reduce the amount of storage needed in the first place (and it can also help with intermittency, too).
As noted earlier, wind electricity generation varies somewhat predictably from month-to-month, and each region of the US has its own seasonal pattern. An ideal transmission network could enable regions regularly producing more wind energy to send it where electricity is more scarce (and therefore, more expensive). On a shorter timescale, a robust transmission grid would enable more resiliency against weather – if it’s sunny in Houston but cloudy in Austin, it could be cheaper to transmit power from Houston to Austin rather than have Austin rely on stored electricity from earlier. Currently, however, the three main interconnections (the Eastern Interconnection, the Western Interconnection, and ERCOT) all have to balance supply and demand independently; there’s limited existing capacity to transmit power from one interconnection to another. This in turn drives up storage and generation capacity requirements for each interconnect – if the Eastern Interconnect experiences an electricity generation shortage and could receive power from ERCOT instead of tapping storage/reserve generation capacity, then the overall need for these resource goes down, as they’re only necessary when both ERCOT and the Eastern Interconnect combined face a generation shortfall. Building transmission lines may be cheaper than building out excess generation or storage capacity [xxxvii].
Even beyond seasonality and intermittency, an upgraded transmission grid could enable a large boost to solar and wind electricity generation. The maps below show the differences in generation potential for wind and solar across the US:

Figure 14: Maps of US Wind (left) and Solar (right) Capacity Factors [xxxviii]
While this doesn’t show seasonal variation, there’s a clear stretch of high capacity factors for wind down the Great Plains, and for solar in the southwestern US. However, if you look at where electricity is produced (a reasonable approximation for where electricity is consumed), you’ll note a relative lack of power plants in the region:

Figure 15: Map of US Electricity Generators [xxxix]
Put simply: electricity isn’t demanded where wind and solar electricity are plentiful and cheap – there just aren’t many people living in the Great Plains, compared to California, New England, or the Great Lakes region. However, it’s difficult to transmit power over long distances to those demand centers with our current transmission infrastructure. The following map lays out what that transmission infrastructure looks like [24]. Darker blue lines form the Western Interconnect, purple lines represent the Eastern interconnect, and ERCOT is colored cyan. Pink triangles (“back-to-backs”) represent connections between the interconnections, and pink lines represent high-voltage direct-current (HVDC) transmission cables, used for high-efficiency, high-volume power transfer.

Figure 16: Current US Power Grid Transmission Capacity [xl]
Combining these maps brings together a clear picture of one of the roadblocks to further deployment of wind and solar in the United States. Fully exploiting solar and wind potential is difficult when the transmission capacity isn’t available to bring clean electricity to places where it could be used. Furthermore, cross-interconnect electricity transmission is limited by back-to-back capacity: 800 MW of capacity between the East Interconnect and ERCOT, and 1310 MW between the East and West Interconnects [xli].
Texas’ Competitive Renewable Energy Zone (CREZ) initiative serves as a case study for building out transmission lines to enable growth in renewables. Wind power in Texas had a booming period of growth: between 2000 and 2005, wind capacity grew at an annual rate of 61%, and electricity produced from wind grew at an annual rate of 54% [xlii]. However, growing pains quickly became apparent: transmission lines began acting as bottlenecks, which forced wind turbines to curtail electricity production and developers to decelerate new projects [xliii]. Texas’ state legislature authorized the initiative in 2005 with the goal of building transmission lines from high-wind-capacity regions of the state (West Texas and the Panhandle region) to population/electricity demand centers (e.g. Dallas and Fort Worth) [xliv]. In 2009, the state Public Utilities Commission selected companies [25] to manage construction. At the time, cost estimates for the 2,376 miles of planned high-voltage transmission lines came in at $4.9 billion. Construction finished in January of 2014, with roughly 3,600 miles of lines being built for $6.9 billion [26], which in turn enabled 18,500 MW of generation capacity to be transmitted [xlv]. As a result, wind energy in Texas took off: Texas now produces more wind energy than any other US state, with Texas alone producing more wind energy than every other country in the world except China, India, Germany, and the United States. From 2014 to 2020, wind electricity produced grew from 40 TWh to 93 TWh, making wind the second-largest source of electricity in Texas (ahead of coal and nuclear) [xlvi].
It’s important to consider the factors that led to CREZ’s success. Cohn and Jankovska lay out the chicken-and-egg problem between renewables and transmission projects: without transmission lines, developers are hesitant to build new solar and wind projects; without credible future renewables projects, companies aren’t willing to undergo the long, bureaucratic process of building transmission lines. Cohn and Jankovska credit the Texas Legislature with having “effectively addresse[d] all three of the requirements for initiating a major transmission project”: (1) establishing a clear need for the project, (2) offering a clear means of payment for the project that split the cost amongst all ratepayers, not just the renewable energy producers (despite their status as the main beneficiaries), and (3) a lack of red tape – since the entire project was inside of Texas, there was only a single agency involved in permitting and siting [xlvii]. The second requirement merits a reiteration of an obvious point: if new generation projects are required to also invest in new transmission capacity, the cost of the project increases immensely when electricity generation and consumption are far apart. Put simply, it’s clear from the above maps that solar and wind potential is somewhat distant from where electricity is consumed. If the onus is on solar and wind project developers to build out transmission infrastructure, then the investment in new wind and solar projects is less attractive, which means less wind and solar power generation.
Another case study for the proactive buildout of transmission lines is found in the Midcontinent Independent System Operator’s (MISO) Multi-Value Project (MVP) transmission expansion plan. Like Texas’ CREZ, the MVP identified transmission upgrades that would work to provide net benefits to the region’s power grid by enabling a build out of wind power generation, rather than a piecemeal method whereby every individual generator would be required to pay for the individual grid upgrades necessary for their project. Results from the MVP include a benefit-to-cost ratio estimate between 2.2 and 3.4, along with an estimated $12.1 to 52.6 billion in net benefits over 20-40 years [xlviii]. MISO estimates that the MVP enabled 52.8 TWh of wind energy.
Having looked at success stories from across the country, let’s turn our attention to some proposed expansions to the national transmission network. Breakthrough Energy (BE) [27] uses the term “Macro Grid” to refer to their proposed nationwide transmission networks [28] designed to support strong growth in renewables – “networks” since they present four proposals, each with differing approaches to the same goal of enabling 70% decarbonized electricity by 2030, which would in turn reduce emissions by about 46% [xlix]. The map below showcases the infrastructure improvements required in each of the four scenarios:

Figure 17: Infrastructure Upgrades Proposed by Breakthrough Energy [l]
In Design 1, the only transmission upgrades are done only to alternating current (AC) transmission lines, which maintains the status quo of the three interconnects’ (ERCOT, the Western Interconnect, and the Eastern Interconnect) ability to send power from one to another. Design 2A, meanwhile, combines more modest some improvements in AC transmission lines with increased capacity at the back-to-backs, allowing more electricity to move from one interconnect to another. Design 3 features the least amount of AC transmission upgrades combined with a network of HVDC lines that still maintain the ability to move from one interconnect to another. Finally, Design 2B combines elements from all three designs, modestly upgrading some AC lines while also increasing capacity of back-to-backs and building HVDC lines to bridge the Western and Eastern Interconnections. BE quotes a similar approximate cost for each of the four scenarios, at around $220 billion [29][li], but notes that it enables an increase in renewable energy from 50% of power generated to 80%.
Other proposed transmission networks exist, with some focusing more on HVDC lines [lii] and others focusing more on the back-to-back capacities [liii]. I’ve primarily focused on BE’s proposals due to the recency of their release (in January of 2021), which implies the most recent available data, though the overall point is that grid decarbonization needs to focus on both generation and transmission capacity.
At the same time, expanding national transmission capacity across interconnects shouldn’t be viewed as an easy fix. In late 2009, filings were submitted [liv] for approval for the Tres Amigas Superstation, which was intended to act as a bridge between the three interconnects with the ability to send 20 GW of power from any region to another [lv]. This should have helped reduce price disparities (reflective of supply-demand imbalances) between the three regions. The filing estimated a completion date of 2014, though the last update from the developer was a scope reduction in late 2016 [lvi]. Ultimately, Tres Amigas should serve as a warning that bridging the interconnects won’t be easy.
2.4 Overbuilding Capacity
Overbuilding refers to building out generation capacity to a level that is sufficient for worst-case scenarios (both on the supply and on the demand side). Indeed, such a concept is core to grid reliability: even on the hottest day in summer or the coldest day in winter, power is expected to operate nonstop, which is why current grids maintain generation assets for tail-end events that go largely unused during most of the year (or day): for example, throughout 2020 ERCOT’s (the “Texas interconnect”) total load averaged over 50 GW between 4-7pm, but under 40 GW between midnight and 8am [lvii]. Seasonal [30] variations are also present: ERCOT averaged over 65 GW of systemwide load from 2-7pm during August, but closer to 40 GW during the same time in February. The following two charts plot ERCOT systemwide electricity use throughout a sample day and peak daily use throughout the year.


Figure 18: ERCOT Systemwide Load: (left) Hourly, on 10/13/2020 (right) Peak Daily Demand
Regardless of how much electricity is being actively used, the infrastructure (both in terms of generation and transmission capacity) still exists to serve peak demand. For much of the year, however, some assets sit idle, since only the least expensive units will run when the system doesn’t need all generators running to produce power. Properly serving enough power at all times of the year is one problem; economics and market design is another. The grid needs to properly compensate the generation units that idle 90% but are nonetheless crucial for overall grid reliability. At the same time, backup capacity shouldn’t be too well rewarded – building out unnecessary capacity is expensive.
A fully decarbonized power grid that relies more heavily on wind and solar than our current generation mix has to account not just for peaks in demand, but also seasonal reductions in capacity, as noted in Section 1.6. Hypothetically speaking, even if ERCOT had enough wind and solar resources to satisfy 100% of grid demand at 3am during a windy month, that capacity wouldn’t be sufficient by itself to run the grid at 3pm. On the other hand, building enough capacity to meet peak demand on a hot but overcast summer day in Texas would require substantially more generation capacity, which most of the year would be forced to turn off generation (though this would also imply being able to run the entire grid from decarbonized sources nearly all of the time).
To get a sense of why overbuilding of renewables is unlikely to be taken to such extremes, imagine a hypothetical plant built for reliability purposes in a grid that’s dominated by wind and solar electricity. Such a generator would only earn revenue during the highest demand hours of the hottest months of a year [31]. Let’s assume that it costs $1 million to build a 1 MW solar plant (which is roughly close to today’s numbers [lviii]), and that financing for the project is obtained at 5%. This implies that generation from the project has to generate at least $50,000 annually just to reach a breakeven point with interest – and this doesn’t include maintenance and other overhead. Plants that operate for just days a year are unlikely to earn that level of revenue. Already in California (where solar accounts for just over a quarter of all electricity generated [lix]), solar sells electricity into the market for roughly 28% less [lx] than generators that feed power to the grid around the clock [32]. The overall point is that “overbuilding” is likely to occur to levels dictated by market economics. Solar will continue to be installed in markets until it’s unprofitable to do so; wind will act similarly.
For that reason, it’s virtually impossible to prescribe an ideal level of generation capacity that should be present from solar or wind, especially due to the complexity of factors that play a role: How much does building out generation capacity in solar and wind cost? How much solar and wind generation capacity already exists on the grid [33]? How much does seasonality affect wind, solar, or hydropower generation? How much does energy storage cost, and would it be cheaper to build out storage instead of new generation capacity? Answering questions like these can help guide investment into new generation capacity. At the end of this chapter, I examine different scenarios for decarbonizing the power grid which help illustrate the tradeoffs involved between overbuilding, storage, and transmission infrastructure investment.
2.5 Nuclear
In a sense, nuclear represents an ideal energy source. Although not considered a renewable source of power, nuclear represents a source of cheap, zero-carbon power reliable and consistent enough to satisfy baseload demand. Seasonality and intermittency aren’t concerns for nuclear, which can be ramped up or down as needed. Combine this with a quite low fuel cost [34], and it’s clear to see why the US nuclear fleet operates with a capacity factor above 93% [lxi]. Nuclear also represents a scalable solution that isn’t constrained by the availability of natural resources [35]. Furthermore, nuclear power also possesses a geographic-independence advantage: it can be placed much closer to demand centers, which in turn reduces the extent to which transmission infrastructure needs to be built or upgraded, whereas with solar and wind power, the optimal locations for power generation might not necessarily be adjacent to large population centers.
Unfortunately, nuclear has earned a poor reputation over the years due to incidents at Chernobyl in 1986, Three Mile Island in 1979, and Fukushima in 2011. This spawned quite a backlash to the technology; some countries (notably Germany) are in the process of phasing out all nuclear power plants. Indeed, of the operating reactors in the US, only two were constructed in the last 25 years [36][lxii].
Nevertheless, several European countries, including Belgium, Hungary, Slovakia, Ukraine, and France, generate a large portion of their country’s electricity from nuclear [lxiii] (France obtains roughly 70% of its electricity from just 56 nuclear reactors [lxiv]).
In terms of economics, the IEA estimates that extending the lifespan of existing (i.e. fully depreciated) nuclear plants by two decades is the cheapest means of generating electricity from any power source – dirty or decarbonized – with a LCOE of just $33.25/MWh [lxv]. Wind and solar are close in terms of today’s costs at large scales, but nuclear has no intermittency and seasonality problems, and can be run reliably any time of the year to produce massive amounts of power. Despite the aging nuclear fleet, with over 90% capacity over 30 years old, [lxvi] nuclear power plants seem to not face major technical hurdles to extend life beyond 80 years, assuming regular maintenance [lxvii].
However, building new nuclear plants is an entirely different proposition, with light water reactors roughly twice as expensive (with an LCOE of $71.25/MWh) as keeping existing plants running. Building nuclear plants beyond base load purposes destroys economic viability; new plants there are only active, on average, 45% of the time (e.g. in the case of a proposed nuclear plant to deal with seasonality) would have an LCOE above $120/MWh [37]. New nuclear projects also have a very common history of being delayed and over-budget, which may make them politically unpopular [38]. Economic viability of nuclear could change with new technologies, such as Small Modular Reactors (SMRs), though these emerging technologies have yet to be demonstrated at-scale [39]. Barring new capacity additions, nuclear seems to be currently positioned as a “bridge” power source to provide zero-carbon power until other technologies can satisfy base demand.
2.6 Carbon Capture
The role of a negative-carbon technology may seem out of place in a “fully decarbonized” power grid. However counterintuitive it may be, such technology is crucial to enabling a fully decarbonized power grid, especially for the tail end of decarbonization. In the section on overbuilding capacity, I touched on the need to build vastly more infrastructure to cover the tail-end events that might arise, e.g. a week-long winter storm or summer heat wave. But building new infrastructure might be more expensive than finding ways to adapt existing dirty generation capacity to be functionally zero-carbon. In other words, if the long-run cost of running an existing fossil-fueled power plant plus the price of removing all of the carbon produced by that plant is cheaper than the price of building a brand new plant, then it’s better to just use the existing infrastructure. Indeed, natural gas power plants can typically operate for 25 to 30 years [lxviii], which means that new and recently-built natural gas power plants (which made up 34% of new capacity in 2019) could be available to operate until 2050.
Carbon capture, utilization, and storage (CCUS) is one of those negative-carbon technologies [40], with two dominant categories: (1) point capture, which is most useful at large sources of CO2 such as fossil-fueled power plants or heavy industrial emitters (e.g. cement factories), and (2) Direct Air Capture (DAC), which involves removing carbon directly from the atmosphere. In either case, the captured carbon gets stored away, often in an underground geological formation (such as a depleted oil reservoir). CCUS isn’t just for the power sector – many industrial processes are difficult to decarbonize, which makes effective CCUS a requirement for broad decarbonization in general. Adam Baylin-Stern and Niels Berghout from the IEA put this rather bluntly: “In the case of cement production, where two-thirds of emissions are from chemical reactions related to heating limestone (rather than burning fossil fuels), CCUS is currently the only scalable solution for reducing emissions. And in the iron and steel sector, production routes based on CCUS are currently the most advanced and least-cost low-carbon options” [lxix]. Once the world reaches total decarbonization CCUS could help to remove pollutants from the atmosphere directly to begin undoing the increase in atmospheric CO2 levels.
The current status of CCUS, however, is that of a technology that’s still in the process of scaling up. Globally, there were only 21 plants operating at a large scale [41] in 2020 [42], up from 8 a decade prior [lxx]. Unfortunately, with small overall scale comes high overall costs. The IEA estimates the cost for various CCUS technologies, with power generation specifically facing a cost of $40-80/metric ton of emitted CO2 [lxxi]. Roughly two cents to remove a pound of CO2 doesn’t seem all that expensive, but natural gas produces (on average) 0.91 pounds of CO2 per kWh of electricity produced [lxxii]. Thus, abating emissions from producing 1 MWh of electricity from natural gas would cost in the range of $16.55 - $33.09. Coal fired electricity produces 2.21 pounds of CO2 per kWh of electricity produced [lxxiii], which brings the cost of abated emissions to $40.10 - $80.20/MWh. For reference, natural gas’ LCOE is about $37/MWh [lxxiv], which implies a 45-89% increase in price. Coal’s price increase would be even higher. Direct Air Capture is an even more expensive technology, with cost estimates ranging from $134-342/metric ton [lxxv]. At these prices, abating emissions from natural gas power production would cost $55.31-141.17 more per MWh, a price increase roughly between 150 and 380%. Put simply, CCUS is currently an expensive proposition for fossil-fueled power generators.
Nonetheless, costs are likely to decline (as they nearly always do) with scale. There are more than 30 planned commercial CCUS facilities that have been announced [lxxvi]. For DAC specifically, although today’s 15 global operating plants currently capture only [43] 9,000 tons of CO2 annually, one such plant in the US is under “advanced development” with capacity for 1,000,000 tons annually [44]. Indeed, several corporations have intentionally chosen to fund DAC projects in order to drive scale and a reduction in costs [45]. When discussing cost reductions for DAC, Fasihi et al. use 10% and 15% learning rates for their conservative and base cases, respectively [lxxvii].
2.7 The 2035 Report
Having discussed some of the technologies that will be important to getting us to a decarbonized power grid one-by-one, it’s worth examining how they might work together to achieve a more complete grid decarbonization by examining the results of various models and simulations run to generate hypothetical future grids. First, I’ll discuss the “2035 Report” published in June 2020 by UC Berkeley’s Goldman School of Public Policy. As a baseline, the report forecasts a 55% decarbonized power grid by 2035, even without new policies encouraging clean electricity solely due to the economics of cheap solar and wind power [lxxviii]. That number is higher than what’s projected by the EIA, predominantly due to more aggressive cost reduction assumptions in solar and wind-generated electricity (though the assumptions are still reasonable – the EIA’s assumptions are quite conservative). The report outlines a path to achieving 90% decarbonized electricity by the year 2035, which the authors describe as “challenging but feasible” [lxxix].
Step one in decarbonizing the grid involves adding substantial amounts of wind and solar generation capacity – roughly 70 GW each year on average of wind and solar (combined, not each) through 2035, for a total of 1100 GW. For context, during 2019 the US added 15.2 GW of utility-scale wind and solar capacity (in addition to 3.9 GW of small-scale solar capacity) [lxxx], though the US also built roughly 60 GW of natural gas capacity in 2002 [lxxxi]. This gap may seem hard to bridge, so it’s important to consider that averaging 70 GW of added capacity doesn’t require an immediate jump to 70 GW. Furthermore, in 2019 only about 8 GW of capacity was retired. Step two in decarbonizing the grid involves retiring all coal-fired power plants in operation [46], and reducing the amount of electricity generated by natural grid by 70% [lxxxii], which should create the demand for more wind and solar generation capacity to fill the need previously served by these generators. The remaining natural gas capacity is used to maintain overall reliability during tail-end events, though the majority of electricity generation comes from solar and wind. The chart below shows how different electricity generation sources feed into the grid, hour-by-hour, for an average day.

Figure 19: Hourly Generation by Source during an Average Day in a 90% Decarbonized Grid [lxxxiii]
The dark grey line toward the top of the chart shows actual “true” power demand throughout the day. Note how the light green area above the load line represents excess electricity production [47] being used to charge batteries (represented by the grey area on the bottom of the chart), which then kick in when the sun sets to provide power to the grid. This is a clear example of batteries tackling the intermittency problem! The 2035 Report estimates a need for 600 GWh of battery storage capacity for the grid [lxxxiv]. This reduces the amount of power wasted as a result of excess renewable generation (overbuilding), bringing overall annual curtailment down to 14% [lxxxv] (represented by the grey area in the chart).
To model tail-end events, the 2035 report essentially samples previous years’ weather patterns and simulates the proposed grid infrastructure with the data. We can observe how the grid fairs at the “limits” of renewable generation by examining in detail the week during which the grid uses the most natural gas power generation:

Figure 20: Power Generation During Tail-end Events in a Mostly Decarbonized Power Grid [lxxxvi]
On August 1st at 8pm, natural gas feeds in 361 GW to the grid [lxxxvii]. This represents a rather hot summer day (during which people run their home air conditioning units), during a time when solar production begins to diminish and during which wind is also operating at lower-than-average levels (due to standard weather patterns, i.e. seasonality). That establishes the amount of natural gas capacity required to ensure grid reliability.
It’s worth noting that the 2035 Report includes very little in terms of nuclear or natural gas capacity additions to the grid (plants that are currently “in the pipeline” are added to the grid). This seems to be best explained by the report’s assumptions on the capital costs required to build new generation capacity. New natural gas capacity doesn’t need to be built, since existing capacity is sufficient to meet long-term demand [48]. Nuclear, while clean and able to provide baseload power, is assumed to require over 7x the amount of capital to build the same amount of capacity as natural gas [lxxxviii], which helps to explain why wind and solar dominate new capacity additions – it’s cheaper to build new wind and solar generation capacity with batteries and natural gas to supplement power variability than it is to build new nuclear plants, at least according to this model.
Economically, the authors find that such a plan would require a total of $106 billion in investment in new and upgraded transmission lines [lxxxix]. However, it would also reduce premature deaths by 85,000 through 2050, equivalent to $1.2 trillion in saved health damages [xc]. Wholesale electricity prices fall from 5.1 cents/kWh in 2020 to 4.6 cents/kWh in 2050 (though various assumptions can produce results anywhere from 4.2 – 5.6 cents/kWh) [xci], and generate 29 million job-years from 2020 to 2035 (as compared to 20 million job-years in a baseline, no new policy scenario) [xcii].
The 2035 Report makes the intentional choice to focus on 90% decarbonization. 90% decarbonization certainly is a stepping stone on the way to 100%, but the report acknowledges that getting to 100% will require “[t]echnology and market developments… such as through new and lower cost and potentially longer duration forms of storage, enhanced demand response and flexible load, hydrogen created from renewables, modular and flexible nuclear generation, carbon capture use and sequestration, and better grid integration practices” [xciii]. Nevertheless, the accompanying policy report indicates that the 90% by 2035 goal is a step toward 100% decarbonization by 2045 [xciv].
2.8 NREL’s Renewable Electricity Futures Study
A much older study, the 2012 Renewable Electricity Futures Study by the National Renewable Energy Laboratory examined pathways and technologies necessary for various levels of grid decarbonization by 2050, with special focus on 80% renewable penetration (though because nuclear energy isn’t considered renewable, 80% renewable penetration actually represents 88% decarbonization). Despite the age (and thus, outdated cost assumptions for various storage and generation technologies [49]), the larger themes from the study’s findings are worth examining.
Perhaps the most important key finding from the study is that there are multiple pathways available to reaching the target level of renewable penetration, with different pathways manifesting under different scenarios of technology advancement and systemic constraints. For example, constraints on new transmission development led to increases in generation capacity built near demand centers (boosting offshore wind, biomass, and solar specifically); when siting or permitting challenges reduced the availability of resource-constrained technologies such as geothermal or hydropower, wind and solar took their place [xcv]. The charts below shows how different scenarios [50] impact installed generation capacity, even though the end result of 80% renewable penetration is identical in each:

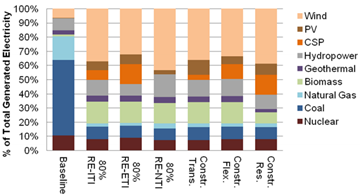
Figure 21: 2050 Generation Capacity (left) and Electricity Generated (right) by Source, Under Different Scenarios [xcvi]
Another theme is the importance of transmission infrastructure expansion in reaching 80% renewable penetration. The study notes three primary benefits: (1) delivering renewable electricity from more remote sources to demand centers, (2) enabling backup generation capacity to be more effectively shared between regions, and (3) smoothing out (i.e. increasing predictability) of the electricity produces by VRE through geospatial diversity. The chart below shows how increasing levels of renewable energy demand both greater regional transmission (blue bars) but also greater capacity for long-distance DC transmission (tan bars), while the map below visualizes the 80% scenario:

Figure 22: New Transmission Infrastructure Requirements, by Renewable Penetration Level [xcvii]

Figure 23: New Transmission Capacity Requirements for 80% Renewable Penetration [xcviii]
2.9 Other Literature
A 2019 report by Tapia-Ahumada et al. from MIT[xcix] investigates the role of nuclear power in a 90% decarbonization scenario. They find that the status-quo implies a roughly 40% generation share from solar and wind, though forcing 90% decarbonization via appropriate carbon taxes (which I’ll cover in Chapter 3) results in only 60% of generation coming from solar and wind (the rest would be covered by natural gas, hydropower, and existing nuclear plants). Ultimately, the report finds a threshold of sorts around 40-45% generation from solar and wind, above which major investments in storage (or nuclear power) are necessary to ensure constant supply-demand equilibrium in the grid. The report also notes that “While technically flexible, the relatively higher capital costs for nuclear did not justify investing in the plants if they were not fully utilized” [c]. Limitations of the report include somewhat-older data for electricity generation costs (from 2017), and no assumed changes to transmission infrastructure between interconnections.
Breakthrough Energy’s 2021 Report “A 2030 United States Macro Grid” [ci] targets achieving 70% clean electricity by 2030. This is primarily accomplished via $220 billion of investment in expanded transmission capacity both between and within grid interconnects (as detailed in Section 2.3) that enables a further $1.3 trillion in investment in solar and wind energy (though this can be driven by market forces, especially if a carbon tax is enacted). The report also mentions the possibility of expanded transmission infrastructure enabling solar to provide power over a longer stretch of time throughout the day: sunset on the East Coast is still afternoon on the West Coast, so transmission infrastructure that enables efficient long-distance power transfer can drive a higher generation share for solar. Limitations of the report include a lack of consideration for energy storage (whether short-term, in the case of batteries, or long-term, in the case of hydrogen), along with a lack of sensitivity testing against various levels of electrification (which could materially change demand patterns).
2.10 Conclusion
Getting to a fully decarbonized grid will require installing enormous amounts of renewable generation capacity, primarily from wind and solar, but these sources come with problems of intermittency and seasonality that require solutions. Batteries represent short-term storage solutions that can aid with intermittency, while hydrogen represents a potential storage solution that can offer large-scale seasonal energy storage. Expanding existing transmission capacity can reduce storage requirements (and therefore, cost) for a reliable clean grid, as can building excess renewable generation capacity. Keeping existing nuclear plants contributing zero-carbon power to the grid enables more zero-carbon power to be produced as the transition is made, though new nuclear plants aren’t favorable under current economics. Existing fossil-fueled generation infrastructure can ensure reliability during long-tail events, and carbon capture can ensure that the overall system is functionally carbon-free. While I haven’t comprehensively addressed every possible technology that could be relevant, the ones I’ve presented here are likely to play large roles in future decarbonization. As evidenced by several studies, there are several paths to achieving zero emissions in the US power system, many of which rely on all-of-the-above strategies. The key takeaway is that such a transition is technically feasible, and required to enable overall economy-wide decarbonization. Having examined the some of the technologies that we’ll need to get the job done, I’ll now turn to the policies needed to enable a departure from the status quo on the path toward zero.
[1] Moss Landing is currently in the process of expanding to 400 MW/1600 MWh, which is expected to be completed in August. This is roughly equivalent to the battery capacity of 20,000 Long Range Tesla Model 3’s, which is to say that it’s a massive battery system.
[2] Electric vehicles integrate numerous small battery “cells” into more complex packs (that often incorporate safety and cooling systems). The cost of batteries at a cell level, therefore, is likely to be cheaper, but even grid batteries require their own (different) packaging.
[3] For example, Tesla’s Battery Day announcement shows their large-scale grid-storage “Megapack” solution relying on a slightly different cathode composition than do their (currently-available) cars, due to a desire to optimize for high cycle life (as opposed to density per unit mass or volume).
[4] Deferring infrastructure spending does save money, when you account for the time-value of money.
[5] For the last point, the idea is that a sufficiently-sized battery can reduce the amount of power that a transmission line may need to carry. As a hypothetical example, imagine a wind/solar farm that’s decently isolated from major users of electricity. Without a battery, the transmission line needs to be capable of handling the maximum output from the power source – otherwise, excess power generation gets curtailed and wasted. With a large enough battery, the transmission line could be built with capacity that’s only large enough as the average amount of power expected to be produced by the power source, since the battery could smooth out the peaks and troughs in electricity generation. Thicker, higher-capacity transmission lines could more to construct, which is where the cost savings comes in.
[6] CAGR stands for Compound Annual Growth Rate. This implies that annual deployments of battery storage will double every 2.9 years.
[7] Specifically, they found that mixes with greater than a 6:1 ratio of solar-to-wind required at most 0.9 to 3.5 TWh of grid storage for the U.S., whereas mixes with a ratio of less than 1:3 of solar-to-wind required at least 0.02 to 0.4 TWh of grid storage. These numbers aren’t perfectly helpful due to (1) one of them is an upper limit, while the other is a lower limit, and (2) there isn’t any specification in the paper on the grid size or the level of clean electricity that amount of storage would enable. Nonetheless, I still think that the broad findings can be relevant.
[8] As a completely hypothetical scenario, assume that we wanted to store enough electricity for the entire US to use for 2 weeks. Given that we produce over 4,000 TWh each year, we’d need to store roughly 150 TWh of electricity, or 150 billion kWh. Using the $137/kWh figure from earlier for the cost of (automotive-sector) batteries, total cost would come to $20.5T, roughly the size of the US GDP. Almost any reasonable assumption in cost reduction makes seasonal-scale energy storage prohibitively expensive.
[9] Often, when hydrogen is discussed as a means of providing power to the grid, it’s shorthand for a system involving renewable electricity powering hydrogen production (i.e. being stored as hydrogen), and generating electricity on demand via fuel cell or a hydrogen-fueled gas turbine.
[10] Steam methane reforming has two reactions: the first has water and methane react to form carbon monoxide and hydrogen: CH4 + H2O ↔ 3H2 + CO. The second converts carbon monoxide to carbon dioxide: CO + H2O ↔ CO2 + H2. Overall, each molecule of methane is capable of producing 4 hydrogen molecules, along with 1 molecule of carbon dioxide.
[11] Technically, blue hydrogen needs to offset not just for the CO2 that’s produced during the actual production process, but also all the emissions along the way: the energy used to obtain the natural gas, any transmission leaks, and a host of other factors. In other words, properly blue hydrogen needs to use carbon capture not just for Scope 1 emissions, but also for Scope 2 and Scope 3.
[12] 1 megaton = 1 million tons = 1 billion kilograms.
[13] The MW rating on an electrolyzer refers to the amount of power that can be fed into the electrolysis process. In other words, a 1 MW electrolyzer uses 1 MW of power to split water. Arguably, it would make more sense to measure hydrogen production capacity in terms of mass or volume produced per unit time. The DOE notes that 100 MW of capacity can produces 50 tons of H2 daily, assuming full-time operation, at https://www.energy.gov/eere/fuelcells/fact-month-august-2018-global-electrolyzer-sales-reach-100-mw-year. You can convert between mass and volume by using 1 kg H2 = 11.89 Norm cubic meters (Nm3), which measures volume at 59 degrees Fahrenheit and standard atmosphere pressure.
[14] The number quoted here is specifically for transmission pipelines of length 1000 km.
[15] I’d highly recommend anyone interested in hydrogen to read the two-part deep dive on hydrogen’s economics by BloombergNEF’s Michael Liebreich. Part 1 is available at https://about.bnef.com/blog/liebreich-separating-hype-from-hydrogen-part-one-the-supply-side/ and Part 2 is available at https://about.bnef.com/blog/liebreich-separating-hype-from-hydrogen-part-two-the-demand-side/. Hydrogen could have a large role to play for overall carbonization, particularly for long-distance transportation by air or by sea, or for the manufacturing of fertilizer, steel, and cement/concrete. These industries are notoriously difficult to decarbonize with current technology, and hydrogen could play a crucial role in driving change. I’d also highly recommend Chapter 5 of Bill Gates’ How to Avoid a Climate Disaster.
[16] This means that the battery can discharge 89.5 kWh of electricity to the grid after being charged with 100 kWh of electricity.
[17] Calculating this involves numerous technicalities, but the 83% figure is based on mostly European conventions.
[18] This is mostly because storing electricity for just a few hours implies higher cycling on the equipment, which in turn implies that you can spread out initial investment costs over a larger base.
[19] I assume 60% efficiency in converting hydrogen to electricity, and use 33.6 kWh / kg H2 for hydrogen’s energy density. That implies that 33.6 x 60% = 20.16 kWh of electricity can be generated from 1 kg H2, and $1.90 / 20.16 kWh = $0.0942, or 9.42 cents per kWh.
[20] I use $62/kWh of capacity for this purpose, which is implied from an 18% learning rate (as used by Bloomberg New Energy Finance). In other words, each doubling of cumulative production in batteries will be associated with an 18% cost decrease.
[21] I assume capital costs of $62/kWh for batteries in 2030, 5% annual (nominal) interest, and 90% round-trip efficiency. Essentially, the battery costs $3.10/kWh each year in interest expense, and this expense is spread over each cycling of the battery. By calculating ($3.10 / 36) / 90%, we obtain 9.57 cents/kWh, roughly the same levelized cost of storage as today’s depleted gas field storage cost for hydrogen.
[22] Some batteries will exist and be cost competitive in terms of handling intermittency issues, and providing hours of grid storage. However, solving the seasonality problem with batteries requires building battery capacity far beyond what’s needed for daily storage. In other words, the batteries that were “built for seasonality” are probably only going to be used a few times per year, not 36.
[23] The only specifics reported are that Mitsubishi Power Americas is receiving north of $3 billion to build plants with 3,284 MW of capacity. Assuming that “more than $3 billion” means definitely less than $4 billion, there’s an upper limit on capital costs of $1,218/kW.
[24] The electricity grid is one of the most complex, large, and fascinating machines that humanity has built, and this map does an excellent job of showcasing that.
[25] Specifically, the PUC selected which Tranmission Service Providers would be responsible for construction.
[26] Plans were developed based on straight-line routing from point to point. In other words, the transmission line would go directly from A to B. Many landowners objected to high-voltage power lines being built on their land, and so many power lines instead followed fences or roads. The cost overruns from the project mostly stem from this extra distance – indeed, the cost increase (about 40%) is nearly proportional to the distance increase (about 50%).
[27] BE is a very well-funded organization, founded by Bill Gates and counting Jeff Bezos, Marc Benioff, Michael Bloomberg, Jack Ma, Richard Branson, Reid Hoffman, Mark Zuckerberg, and others as members.
[28] The entire model is open-sourced and available online at https://breakthrough-energy.github.io/docs/
[29] Specifically, Design 1 has a forecasted cost of $220 billion, Design 2A has a forecasted cost of $211 billion, Design 2B has a forecasted cost of $214 billion, and Design 3 has a forecasted cost of $223 billion.
[30] Granted, this terminology would imply the existence of seasons in Texas, so perhaps another word that more closely aligns with reality should be used.
[31] Indeed, this scenario is highly contrived – a solar or other zero-marginal-cost generator isn’t likely to be idle for most of the year, which is why this scenario relies on the grid is dominated by other zero-marginal-cost generators.
[32] Solar only produces power when the sun is shining, so producing 25% of electricity on average hides the fact that solar often accounts a large portion (if not a majority) of grid power production during the day and zero at night. Because so much energy is being produced during the day, the electricity markets only need to rely on a few non-VRE sources for electricity, and the markets will prioritize the lowest-marginal-cost producers. This implies low market rates when the sun is shining (and higher rates at other times). Each solar panel reduces the value of the next one to be installed.
[33] This is important to ask because it gets at the profitability of new VRE projects. In a grid with near-total dominance of solar and wind, a marginal unit of new generation capacity is unlikely to be profitable, since the marginal value of electricity produced is likely to be low – if that new project is producing electricity, the system overall is likely to be dominated by near-zero-marginal-cost production. Likewise, in a system that’s almost entirely dependent on generation sources with marginal fuel costs to produce electricity (e.g. nuclear, coal, natural gas, etc.), a new VRE project would not only be competing favorably against other producers, but would likely always be able to sell its product to the grid. Electricity market design (especially in a world dominated by zero-marginal-cost producers!) is an enormously complex topic that I choose to not go into much detail, though the interested reader can find a primer at https://www.rff.org/publications/explainers/us-electricity-markets-101/.
[34] The IEA puts the cost of nuclear fuel at $9.33 per MWh, which is under a penny per kWh. Fuel costs for coal and gas, for comparison, are around $30 per MWh. You can explore fuel costs and capital costs at https://www.iea.org/articles/levelised-cost-of-electricity-calculator.
[35] Specifically, a contrast should be drawn between nuclear and geothermal or hydropower. A 2014 article (https://www.energy.gov/articles/energy-dept-report-finds-major-potential-grow-clean-sustainable-us-hydropower) by the Oak Ridge National Laboratory estimated that “potential new hydropower development across more than three million U.S. rivers and streams [was] nearly equivalent to the current U.S. hydropower capacity”. But hydropower only accounts for roughly 7% of current US electricity production, which means that hydropower won’t truly move the needle for getting to a fully decarbonized power grid. The story is similar for geothermal power: a 2008 USGS study (https://pubs.usgs.gov/fs/2008/3082/) estimated that known geothermal sites had the potential for 9 GW of generation capacity, and estimated that unidentified sites could potentially provide 30 GW of generation capacity. Geothermal plants tend to run with a high capacity factor, which means that there’s some level of disproportionate production in favor, but ultimately this pales in comparison to the 70 GW peak demand of ERCOT alone. These sources, while clean, just aren’t sufficiently scalable for the problem at hand.
[36] The EIA notes that the “newest reactor to enter service is Tennessee’s Watts Bar Unit 2, which began operation in June 2016. The next-youngest operating reactor is Watts Bar Unit 1, also in Tennessee, which entered service in May 1996.”
[37] The IEA, in determining the original LCOE estimate of $71.25/MWh, ascribes $50.32 to capital costs. If we halve the utilization of the proposed generator, the capital costs of the plant are spread out over half the electricity base, which functionally means doubling capital costs (per MWh produced), resulting in a new LCOE of $121.57/MWh. I choose 45% as a utilization factor since it’s roughly half of the US nuclear fleet’s current 93% capacity factor.
[38] I’d recommend a piece by BloombergNEF’s Michael Liebreich on nuclear power for a sampling. It’s available at https://about.bnef.com/blog/liebreich-need-talk-nuclear-power/.
[39] The IEA published a report in May of 2019 that outlined “innovation gaps” – essentially, important technologies that faced technical challenges to mass adoption. Nuclear power has its own section (available at https://www.iea.org/reports/innovation-gaps/other-power#nuclear-power), which notes that “the first examples of SMRs… are expected to begin operating in the 2020s”.
[40] Technically, CCUS refers to a category of technologies, as there are multiple methods of capturing carbon and storing it.
[41] The IEA defines large-scale as capturing 800,000 tons of CO2 annually (if attached to a coal-fired power plant) or at least 400,000 tons of CO2 annually for other industrial facilities.
[42] There are actually 94 active projects worldwide, and 31 of those are in the US, but this count includes projects of any scale. The National Energy Technology Laboratory has a tracker of CCUS projects at https://www.netl.doe.gov/coal/carbon-storage/worldwide-ccs-database.
[43] Global annual emissions are around the range of 50 gigatons, or 50,000,000,000 (50 billion) tons. More information breaking this down by country can be found at https://ourworldindata.org/greenhouse-gas-emissions. In any case, 9,000 tons isn’t really all that much.
[44] The project is being led by Carbon Engineering and Oxy Low Carbon Ventures, which is a subsidiary of Occidental Petroleum, the oil and gas exploration and production company. The project is expected to begin construction sometime this year, and should be operational by 2023. More information can be found at https://carbonengineering.com/news-updates/expanding-dac-plant/.
[45] One such example is Stripe Climate, which The Atlantic wrote about here: https://www.theatlantic.com/science/archive/2020/11/stripe-climate-carbon-removal/617201/.
[46] There is the question on whether forcing coal plants to retire by an arbitrary date is “fair” to the owners of the plants. Most plant owners slowly depreciate the value of their generation assets over time on their balance sheet, though even in 2035 not all assets will be fully depreciated. For that reason, the report discusses the merits of “securitization of these balances through government- or ratepayer-backed bonds”, which the interested reader can learn more about at https://energyinnovation.org/wp-content/uploads/2020/06/90-Clean-By-2035-Policy-Memo_June-2020.pdf.
[47] Technically speaking, excess electricity overall is being used to charge batteries, not ”just” excess solar production.
[48] According to the report’s appendix, we have roughly 540 GW of existing natural gas capacity installed, which represents a healthy margin compared to the 361 GW that we might need in a worst-case scenario. Even with certain safety margins, it appears that new natural gas capacity isn’t needed.
[49] Outdated cost assumptions are most visible in the “business-as-usual” scenario. The NREL REF study assumes a baseline of 20% renewable generation in 2050 – a couple of percentage points away from where we are currently. Some more outdated aspects of the study are clearly visible roughly nine years later: photovoltaic (PV) solar systems have won out over solar thermal systems; wind and solar costs declined faster than anticipated; battery technology rapidly became cost-competitive for grid storage; coal appears moribund faced with competition from natural gas.
[50] The six scenarios are: (0) Baseline, which represents a “business-as-usual” scenario (from the lens of 2012), (1) 80% Renewable Energy with Incremental Technology Improvements, (2) 80% Renewable Energy with Evolutionary Technology Improvements, (3) 80% Renewable Energy with No Technology Improvements, (4) Constrained Transmission, (5) Constrained Flexibility, and (6) Constrained Resources.
Sources
[i] http://css.umich.edu/factsheets/us-grid-energy-storage-factsheet
[ii] https://www.sandia.gov/ess-ssl/global-energy-storage-database-home/, “GEDDB_Projects_11_17_2020.xlsx”
[iii] https://www.eia.gov/analysis/studies/electricity/batterystorage/pdf/battery_storage.pdf, page 6
[iv] https://www.eia.gov/todayinenergy/detail.php?id=45596
[v] https://hornsdalepowerreserve.com.au/
[vi] https://en.wikipedia.org/wiki/Hornsdale_Power_Reserve
[viii] https://www.eia.gov/todayinenergy/detail.php?id=45596
[xi] https://www.nrel.gov/docs/fy19osti/74426.pdf
[xii] https://www.energy.gov/sites/prod/files/2020/12/f81/Energy%20Storage%20Market%20Report%202020_0.pdf, page 9
[xiii] https://www.sciencedirect.com/science/article/pii/S0959652618301665
[xiv] https://www.nature.com/articles/nclimate2921
[xv] https://www.ft.com/content/7eac54ee-f1d1-4ebc-9573-b52f87d00240
[xvi] https://h2tools.org/hyarc/calculator-tools/energy-equivalency-fuels
[xvii] https://rmi.org/run-on-less-with-hydrogen-fuel-cells/
[xx] https://www.iea.org/fuels-and-technologies/hydrogen
[xxiii] https://data.bloomberglp.com/professional/sites/24/BNEF-Hydrogen-Economy-Outlook-Key-Messages-30-Mar-2020.pdf, page 3
[xxiv] https://data.bloomberglp.com/professional/sites/24/BNEF-Hydrogen-Economy-Outlook-Key-Messages-30-Mar-2020.pdf, page 4
[xxv] https://data.bloomberglp.com/professional/sites/24/BNEF-Hydrogen-Economy-Outlook-Key-Messages-30-Mar-2020.pdf, page 4
[xxvi] https://about.bnef.com/blog/hydrogen-economy-offers-promising-path-to-decarbonization/
[xxvii] https://cafcp.org/by_the_numbers
[xxviii] http://www.koreaherald.com/view.php?ud=20201214000735
[xxx] https://www.tesla.com/powerpack
[xxxi] https://www.europarl.europa.eu/document/activities/cont/201202/20120208ATT37544/20120208ATT37544EN.pdf, page 191
[xxxii] https://www.nrel.gov/docs/fy10osti/47302.pdf, page 12
[xxxiii] https://about.bnef.com/blog/liebreich-separating-hype-from-hydrogen-part-two-the-demand-side/
[xxxv] https://www.eia.gov/analysis/studies/powerplants/capitalcost/pdf/capital_cost_AEO2020.pdf, page 28
[xxxvi] https://www.eia.gov/analysis/studies/powerplants/capitalcost/pdf/capital_cost_AEO2020.pdf, page 28
[xxxvii] https://www.nature.com/articles/nclimate2921
[xxxviii] https://www.nature.com/articles/nclimate2921/figures/1
[xxxix] https://www.washingtonpost.com/graphics/national/power-plants/
[xl] https://science.breakthroughenergy.org/
[xli] https://bescienceswebsite.blob.core.windows.net/publications/MacroGridReport.pdf, page 27
[xlii] https://en.wikipedia.org/wiki/Wind_power_in_Texas
[xliii] https://www.bakerinstitute.org/files/16576/
[xliv] http://www.ettexas.com/Projects/TexasCrez
[xlv] https://www.energy.gov/sites/prod/files/2014/08/f18/c_lasher_qer_santafe_presentation.pdf
[xlvi] https://windexchange.energy.gov/states/tx
[xlvii] https://www.bakerinstitute.org/files/16576/
[xlviii] https://cdn.misoenergy.org/MTEP17%20MVP%20Triennial%20Review%20Report117065.pdf, page 4
[xlix] https://science.breakthroughenergy.org/
[l] https://bescienceswebsite.blob.core.windows.net/publications/MacroGridReport.pdf, page 5
[li] https://science.breakthroughenergy.org/key-findings/macro-grid
[lii] https://www.nature.com/articles/nclimate2921
[liii] https://www.nrel.gov/analysis/seams.html
[liv] http://www.tresamigasllc.com/docs/PR-FERC-Filing-12-09.pdf
[lv] https://ieeexplore.ieee.org/abstract/document/7367461
[lvi] http://www.tresamigasllc.com/docs/Tres-Amigas-aims.pdf
[lvii] http://www.ercot.com/gridinfo/load/load_hist, “2020 ERCOT Hourly Load Data.xlsx”
[lviii] https://www.irena.org/-/media/Files/IRENA/Agency/Webinars/2020/Jun/IRENAinsight-webinar_RPGC-in-2019-Overview.pdf, Slide 11
[lix] https://www.bloomberg.com/news/articles/2021-03-11/california-s-solar-industry-is-getting-sunburned
[lx] https://www.bloomberg.com/news/articles/2021-03-11/california-s-solar-industry-is-getting-sunburned
[lxi] https://www.eia.gov/electricity/annual/html/epa_04_08_b.html
[lxii] https://www.eia.gov/tools/faqs/faq.php?id=228&t=21
[lxiv] https://www.world-nuclear.org/information-library/country-profiles/countries-a-f/france.aspx
[lxv] https://www.iea.org/articles/levelised-cost-of-electricity-calculator
[lxvii] https://eprijournal.com/nuclear-plant-life-extension-a-strategic-bridge/
[lxviii] https://sargentlundy.com/wp-content/uploads/2017/05/Combined-Cycle-PowerPlant-LifeAssessment.pdf
[lxix] https://www.iea.org/commentaries/is-carbon-capture-too-expensive
[lxx] https://www.iea.org/fuels-and-technologies/carbon-capture-utilisation-and-storage
[lxxi] https://www.iea.org/commentaries/is-carbon-capture-too-expensive
[lxxii] https://www.eia.gov/tools/faqs/faq.php?id=74&t=11
[lxxiii] https://www.eia.gov/tools/faqs/faq.php?id=74&t=11
[lxxiv] https://www.eia.gov/outlooks/aeo/pdf/electricity_generation.pdf, page 6
[lxxv] https://www.iea.org/commentaries/is-carbon-capture-too-expensive
[lxxvi] https://www.iea.org/commentaries/is-carbon-capture-too-expensive
[lxxvii] https://www.sciencedirect.com/science/article/pii/S0959652619307772
[lxxviii] http://www.2035report.com/wp-content/uploads/2020/06/2035-Report.pdf, page 15
[lxxix] http://www.2035report.com/wp-content/uploads/2020/06/2035-Report.pdf, page 4
[lxxx] https://www.eia.gov/todayinenergy/detail.php?id=37952
[lxxxi] http://large.stanford.edu/courses/2012/ph240/nam2/docs/epa.pdf, Table 1.1.A
[lxxxii] http://www.2035report.com/wp-content/uploads/2020/06/2035-Report.pdf, page 4
[lxxxiii] http://www.2035report.com/wp-content/uploads/2020/06/2035-Report.pdf, page 18
[lxxxiv] http://www.2035report.com/wp-content/uploads/2020/06/2035-Report.pdf, page 16
[lxxxv] http://www.2035report.com/wp-content/uploads/2020/06/2035-Report.pdf, page 16
[lxxxvi] http://www.2035report.com/wp-content/uploads/2020/06/2035-Report.pdf, page 18
[lxxxvii] “2035 Appendix”, page 41, available at https://cta-redirect.hubspot.com/cta/redirect/6000718/e9988aee-c28a-4387-858e-46fc555dd5a8
[lxxxviii] “2035 Appendix”, page 14, available at https://cta-redirect.hubspot.com/cta/redirect/6000718/e9988aee-c28a-4387-858e-46fc555dd5a8
[lxxxix] http://www.2035report.com/wp-content/uploads/2020/06/2035-Report.pdf, page 24
[xc] http://www.2035report.com/wp-content/uploads/2020/06/2035-Report.pdf, page 5
[xci] http://www.2035report.com/wp-content/uploads/2020/06/2035-Report.pdf, page 21
[xcii] http://www.2035report.com/wp-content/uploads/2020/06/2035-Report.pdf, page 27
[xciii] “2035 Appendix”, page 68, available at https://cta-redirect.hubspot.com/cta/redirect/6000718/e9988aee-c28a-4387-858e-46fc555dd5a8
[xciv] https://energyinnovation.org/wp-content/uploads/2020/06/90-Clean-By-2035-Policy-Memo_June-2020.pdf
[xcv] https://www.nrel.gov/docs/fy12osti/52409-1.pdf, page 35
[xcvi] https://www.nrel.gov/docs/fy12osti/52409-1.pdf, page 120
[xcvii] https://www.nrel.gov/docs/fy12osti/52409-1.pdf, page 43
[xcviii] https://www.nrel.gov/docs/fy12osti/52409-1.pdf, page 44
[xcix] https://globalchange.mit.edu/sites/default/files/MITJPSPGC_Rpt338.pdf
[c] https://globalchange.mit.edu/sites/default/files/MITJPSPGC_Rpt338.pdf, page 22
[ci] https://bescienceswebsite.blob.core.windows.net/publications/MacroGridReport.pdf