In this section, I lay out the highlights of some policies that can be helpful in steering the power grid toward decarbonization. Due to the limited scope of this paper, this section is by no means comprehensive, though it provides a high-level overview of valuable policy tools.
3.1 Renewable Portfolio Standards
Renewable Portfolio Standards (RPSs, sometimes called Renewable Electricity Standards) are top-down mandates given by governments [1] that require certain levels of renewable electricity by given target dates. To that extent, they act as forcing functions on top of market-based system, though they don’t necessarily drive growth beyond a minimum level. In the US, 30 states have RPSs in place, no two of which are the same [2]: programs can differ due to targets, dates, technologies included, local industries and lobbying power, existing resources for renewables, existing renewable generation, etc. The vast majority require a certain percentage of electricity to come from approved renewable sources, while a few exceptions (Iowa, Texas, and Kansas) require a certain level of generation capacity (i.e. these states set goals for MW, not MWh) [i]. Where standards are based on a percentage of electricity consumed, credit-based systems are common (most frequently called Renewable Energy Credits, RECs), and these allow utilities that produce more renewable electricity than mandated to sell credits to utilities that lack sufficient RECs. A majority of states with RPSs specifically target certain technologies with “carve-outs” (a sub-mandate that specifies a target level for a target technology) or credit multipliers (where certain technologies are awarded more credits). For example, Texas’ RPS includes a carve-out provision that mandates 500 MW of generation capacity of non-wind renewable sources. North Carolina’s RPS (established in 2007) includes carve-outs that mandate 0.2% of electricity production from swine waste. Often, Renewable Portfolio Standards are not Zero-Carbon Portfolio Standards, which means that nuclear energy and fossil-fueled electricity generation plants paired with carbon capture may not contribute to a target goal, depending on the state.
The effectiveness of an RPS depends entirely on what standards are set. If the targets are set too low, such that business-as-usual development will automatically surpass the requirements, then the RPS doesn’t actually spur new development in renewable power. Texas’ RPS, which last updated in 2005, mandated a minimum of 5,880 MW of renewable generation capacity by 2015, and included a voluntary target of 10,000 MW by 2025 [ii]. The 10,000 MW target was surpassed by wind alone in 2010, 15 years early. In 2005, a 10,000 MW goal by 2025 may have been ambitious – it represented a 400% increase in wind capacity over what existed at the time [iii] – but a lack of further updates to the standard have rendered it useless at driving new renewable capacity, as market forces are now more powerful. At the same time, Texas’ RPS included a voluntary carve-out which targeted 500 MW of capacity from renewable sources other than wind by 2015 (which was largely assumed to target solar generation specifically). This target was just late, being met in May 2016 [iv]. Had there been a penalty mechanism that could have driven actual investment in generation capacity, the RPS could have advanced the progress of Texas’ solar industry by a few months [3]. On the flip side, RPSs can’t be set too aggressively, either: government mandates need to be realistic and achievable, otherwise pressure will mount to later weaken the requirement [4]. Utilities are better able to make capacity investment decisions in a stable legal environment. If the goal is to use an RPS to drive decarbonization in the electricity sector, RPSs should be set ambitiously without being unrealistic.
RPSs assisted the initial phase of scaling-up renewables: combined with other programs such as the Production Tax Credit (discussed in a later section) the EIA claims that “[r]oughly half of all growth in U.S. renewable electricity generation and capacity since 2000 is associated with state RPS requirements” [v]. However, their effectiveness has diminished over time as market-based forces have driven recent growth of renewables: RPSs were responsible for less than 30% of new renewable capacity in 2018 [vi]. Depending on your political view, this may be the ideal role for government to play in driving clean energy forward: regulation assists new technologies achieve cost-competitiveness, after which free-market forces drive growth. If the goal is rapid decarbonization of the electricity sector, however, RPSs (as currently set by states today) aren’t ambitious enough: a report from the EIA dated March 2020 estimates that “eliminating current state RPS requirements would reduce renewable generation by 4% by 2050” [vii]. However, some states (Maine, New York, California, Hawaii, Nevada, New Mexico, and Washington) have RPSs that require 100% carbon-free electricity by 2050 [viii].
For all their variety and complexity, and despite the current lack of strength, RPSs have a unique advantage over other policies that I’ll cover in later sections: they exist – 30 states (with governors and state legislatures on both sides of the political aisle) have already passed bills enacting RPSs. This confers an advantage for seeking to use RPSs as a policy driver for decarbonization, since government and industry alike have real-world experience in the US. Well-designed PRSs [5] should be more politically favorable.
The 2035 Report advocates for the implementation of a federal-level clean electricity standard [ix] (i.e. one that includes nuclear and fossil-fueled generation paired with carbon capture), with targets of 55% clean electricity by 2025, 75% by 2030, 90% by 2035, and 100% by 2045. These federal targets should be complemented with state-level targets. Likewise, Breakthrough Energy also advocates for a federal-level clean electricity standard that mandates 100% carbon-free power by 2050, along with interim targets every five years [x].
3.2 Carbon Pricing
A highly effective strategy for reducing emissions is to internalize the external costs of pollution: that is, to put a price on carbon. By creating a price to pollute, polluters will factor in some of the social cost of polluting into their economic decisions, driving down emissions. Two popular methods for carbon pricing: carbon taxes and carbon cap-and-trade systems. At its core, a carbon tax is a tax put on emissions – unlike an RPS, which acts only as a forcing function, a carbon tax drives emissions down without limit: there’s no threshold where incentives to not pollute drop off. Carbon cap-and-trade systems function similar to RECs: essentially, a central government establishes a maximum level of annual emissions, and credits can be traded amongst polluters to establish a market price for the cost of carbon. The benefit of the cap-and-trade system is that markets determine prices based on emissions goals (and the fact that you get to quantify exactly how you want emissions to decrease over time), though the downside is the threshold after which emissions reductions aren’t economically rewarded. In either scenario, the benefit is an economically-optimal method for reducing emissions: emissions will be abated in any feasible manner in order of cost, unlike cruder policy tools that target specific technologies or industries.
Some states in US (California, Washington, and a few states in New England) have implemented carbon cap-and-trade systems, though no states have implemented carbon taxes. Several countries (e.g. Mexico, Japan, and several European nations) have implemented carbon taxes and several more (e.g. China, New Zealand, nearly all of Europe) have implemented carbon cap-and-trade schemes [xi]. The map below shows where carbon taxes have been implemented (blue regions), along with where carbon cap-and-trade has been implemented (green regions):
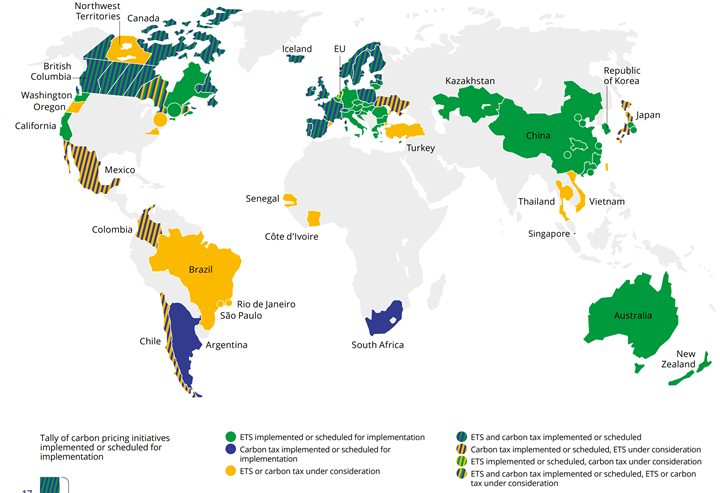
Figure 24: Global Implementation of Carbon Pricing Schemes [xii]
In this section, I’ll mostly focus on carbon taxes due to their relative simplicity (and the pervasiveness of modeling done with carbon taxes), though most of the points in this section apply to a carbon cap-and-trade system also. Carbon taxes have enormous potential: estimates of the emissions reduction in 2030 (compared to 2005 levels) are between 39-46% with a $50/metric ton real price [6], compared to a 19-26% reduction under a scenario without a carbon price [xiii]:

Figure 25: Projected Reductions in GHG Emissions from 2005 to 2030, by Carbon Price [xiv]
Roughly 80% of the additional avoided emissions driven by such a price would come from the electricity sector, as more polluting sources of electricity would be replaced with lower- or zero-carbon forms of generation: at $50/metric ton, the price of coal-fired electricity would increase by $50.12/MWh (making it uncompetitive against renewables just in operating cost alone), while the price of natural gas-fired electricity would increase by $20.64/MWh [7].
Breakthrough Energy provides insights on how to design an effective carbon tax (again, many of these principles apply to cap-and-trade systems also) [xv]. One crucial point is to balance the desire to account for as many emissions sources as possible across the economy while also reducing the amount of administrative burden required. To that extent, an ideal system would find the easiest steps in the economic supply chain to assess the tax (e.g. at the source for coal, natural gas, and petroleum). Also crucial would be to include a border adjustment for goods that are exported or imported from the US, so that domestic industries aren’t made uncompetitive by goods originating from foreign countries without a carbon pricing scheme [8]. Finally, carbon capture projects should be able to earn a carbon tax refund to create incentives for emissions reductions by whatever economically viable path is available.
Perhaps the largest question in relation to carbon taxes has to do with where revenues are allocated. Several answers exist, each with their pros and cons: revenues could go to reducing other taxes (e.g. payroll or income tax), could be returned directly to citizens (much like a carbon stimulus, with such checks potentially targeting lower-income households more heavily), could fund infrastructure improvements, carbon capture, or R&D, or could work toward environment justice initiatives by prioritizing improvements and economic revitalization to communities that are currently dependent on fossil-fueled economies or that have been disproportionately impacted by emissions historically.
In any case, carbon pricing programs are most effective when paired with other tools to promote decarbonization (e.g. funding R&D into promising technologies, or reducing emissions that might not be covered with a carbon tax, such as methane leaks). However, when carbon prices are linked to target emissions levels (such that carbon prices increase or decrease as necessary to drive progress toward annual emission goals), the carbon tax can be a potent tool for driving economically-optimal decarbonization across all sectors.
3.3 Policies for Transmission Infrastructure
Lessons from Texas’ CREZ project and MISO’s MVP project could be applied to expanding transmission infrastructure nationally and reducing red tape for potential new generators or transmission developers to accelerate building out necessary electrical infrastructure. To assist developers with siting, the 2035 Report recommends [xvi] pre-screening government-owned lands for new generation and transmission resources in order to identify areas where new generation and transmission projects could be placed with a streamlined review process. Indeed, Texas’ CREZ project required building more miles of transmission lines due to a need to accommodate local landowners’ restrictions on where transmission lines could be placed. Putting all siting considerations in one location could reduce project planning costs and time.
Today’s rules for new generation projects require that developers pay for the cost of transmission upgrades needed to bring new generation onto the grid. This rule works fine for many sources – natural gas, nuclear, and coal-fired power plants are geographically flexible, and can be placed where needed to minimize the amount of distance between electricity generation and usage. However, as exemplified by the CREZ and MVP projects, this may not be the optimal choice for enabling large quantities of wind and solar generation – such transmission upgrades are prohibitively expensive, delaying large amounts of renewable generation projects until such connections are available. The Lawrence Berkeley Lab estimated that interconnection queues held a combined 284 GW of solar capacity nationally [xvii].
To that extent, the 2035 Report recommends taking steps (1) to simplify rules regarding connecting new generation capacity to the grid, (2) to require the expansion of regional transmission (which in turn wouldn’t require individual projects to finance transmission improvements), (3) to block individual states from blocking new regional transmission infrastructure projects without certain criteria being met, (4) to require net-beneficial transmission projects to be pursued, (5) to shift who pays for transmission infrastructure projects by shifting costs from generators to consumers, and (6) to provide matching federal funds to states to fund interstate transmission lines [xviii]. These steps will require action both by Congress and by the Federal Energy Regulatory Commission.
3.4 Subsidizing Emerging Technologies
The tricky part with 100% decarbonization is often the last few percent – existing technologies (e.g. solar and wind generation, batteries for energy storage) are sufficient are large-scale partial decarbonization, but aren’t yet cost-effective enough to cover the long tail of events that 100% decarbonization demands. New technologies and processes are necessary for multiple applications in the power sector: for more efficient solar panels, for longer-term energy storage, for cheap mass-scale carbon capture, etc. An effective plan for total decarbonization (both for the power grid and for the economy as a whole) must address how to effectively support new technologies while they scale. Technologies that were once economically uncompetitive (e.g. solar, wind, lithium-ion batteries) are now workhorses of electricity generation and storage; replicating that lab-to-real-world pathway is crucial. Support is extra important due to the chicken-and-egg problem that faces new technologies: firms are unlikely to emerge given a lack of consumers and limited market; consumers are less likely to trust novel technologies if prices are high. Supporting both consumers and producers while industries scale, technology matures, and costs improve is a crucial job for financial backers, be they public or private.
Indeed, the competitiveness of solar and wind power today is partially due to financial support in the forms of the Investment Tax Credit (ITC) and the Production Tax Credit (PTC)[9]. Between when the ITC was enacted in 2006 to 2020, US electricity generation from solar installations grew 45% per year [xix], compared to basically no growth between 2000 and 2006. For wind, Metcalf (2010) [xx] and Hiraj (2013) [xxi] both found tax credits instrumental in spurring investment in wind. The 2035 Report [xxii] advocates not just for continuing these incentives, but also applying them to storage projects and making such incentives refundable [10].
Breakthrough Energy proposes the use of innovation tax credits [xxiii] to support similar scale-up efforts for other emerging technologies. Ideally, tax credits should be technology-neutral, so that any technology effective at reducing emissions can benefit. At a high level, technologies that merit an innovation tax credit can’t be competitive enough that funds are spent on already-proven technologies. Put another way, the technologies supported by R&D must be sufficiently high-enough risk to be worthy of government support. Other important considerations for an innovation tax credit include making tax credits refundable, paying for performance (e.g. incentives that scale with the amount of electricity produced, storage capacity installed, or carbon captured), and implementing phase-out clauses to prevent incentives being applied to technologies after they reach competitive scale.
3.5 Conclusion
While technological factors are important in enabling decarbonization of the power sector, policies that are enacted will drive adoption of those technologies. Renewable Portfolio Standards are useful forcing functions to mandate a minimum level of clean electricity; carbon taxes can drive further decarbonization by efficiently promoting decarbonization where it’s cheapest. Policies to support the expansion of transmission infrastructure can support the deployment of mature technologies at scale, while subsidies and tax credits for promising technologies can aid their scaling-up to help tackle the long-tail of decarbonization.
These policies are but a sampling of all the policies that will be necessary for driving decarbonization in the power sector and the economy as a whole. Furthermore, policies that I’ve discussed are all largely technology-focused, but human factors matter in ensuring that the transition to a carbon-free system is smooth. Local economies in certain parts of the country are dependent on fossil fuel industries such as coal, oil, and natural gas, and ensuring that the transition doesn’t leave these regions behind is crucial. Other economic considerations include how such a transition will be funded, and what will happen to the stranded assets that exist in the physical world but are left behind as remnants of an older, carbon-intensive world. Numerous proposals exist from various organizations – the breadth of which are vast.
[1] In the US, Renewable Portfolio Standards are all at the state level. However, it’s feasible to imagine a federal-level RPS.
[2] Another 7 states have voluntary targets, though voluntary targets aren’t worth much in terms of actually driving behavior.
[3] A few months difference in reaching 500 MW of solar isn’t a large difference, but it’s a small one that can legitimately push electricity in the right direction.
[4] Historically, this may have occurred as utilities were reluctant to invest into renewable generation capacity due to cost concerns, which would in turn drive up prices for consumers (utilities are highly regulated firms, and costs and prices often travel in lockstep).
[5] NREL identifies some best practices for designing an RPS (https://www.nrel.gov/state-local-tribal/basics-portfolio-standards.html): (1) the targets chosen should ramp up steadily over time, and the targets should remain stable over time without sudden changes made; (2) the program should last long enough to enable long-term contracting and financing; (3) the RPS should apply to all generators, regardless of ownership; (4) there should be clear standards for what types of generation count toward the target; (5) RECs should be used, and there should be a robust tracking system for them; (6) Compliance costs should be spread out fairly across all ratepayers; (7) RPSs should be mandates (not voluntary) and have penalties for not meeting the mandates.
[6] Real means inflation-adjusted. The $50/ton price increases by 2% annually, for the purposes of keeping up with inflation. In Figure 25, the $14/ton price increases by 3% annually, while the $73/ton price increases by 1.5% annually.
[7] At $50/metric ton, carbon emissions are taxed at roughly 2.27 cents per pound. Coal emits about 2.21 pounds of CO2e emissions per kWh generated, whereas natural gas emits about 0.91 pounds CO2e per kWh (https://www.eia.gov/tools/faqs/faq.php?id=74&t=11). These are averages – taxing the fuel instead of the electricity generated would reward more efficient plants while penalizing less efficient ones.
[8] The border adjustment carbon tax would be most crucial for heavy industries such as cement or steel. If other countries adopted a similar carbon pricing scheme to the US, such border adjustments wouldn’t even be necessary, since the countries would already be on an even economic playing field.
[9] A PTC grants subsidies for energy produced – currently, it pays out a small amount for every kWh produced in the first few years of a generator’s operation. An ITC grants subsidies based on the amount of capital invested. The two credits are alternatives to each other: developers select one of the two to apply to their project. Less proven sources of renewable energy (e.g. offshore wind) typically prefer the ITC, since capital costs are higher, and cash flows occur sooner, which assists in financial investment decisions more than an equivalent amount of money distributed over a longer period of time. The Database of State Incentives for Renewables and Efficiency provides more information about the PTC (https://programs.dsireusa.org/system/program/detail/734) and ITC (https://programs.dsireusa.org/system/program/detail/658).
[10] Essentially, this means that firms don’t need to have a tax liability in order to benefit from an incentive. For example, today’s federal tax credit for purchasing an electric vehicle is in the form of a nonrefundable tax credit of up to $7,500. Consumers who purchase an electric vehicle eligible for a $7,500 tax credit but who have less than that owed in taxes don’t obtain the full $7,500, which reduces the overall effectiveness of the incentive.
Sources
[i] https://www.ncsl.org/research/energy/renewable-portfolio-standards.aspx
[ii] https://programs.dsireusa.org/system/program/detail/182
[iii] https://en.wikipedia.org/wiki/Wind_power_in_Texas
[iv] US EIA Electric Power Monthly, July 2016, Table 6.2.B. URL: https://www.eia.gov/electricity/monthly/
[v] https://www.eia.gov/energyexplained/renewable-sources/portfolio-standards.php
[vi] https://www.eia.gov/energyexplained/renewable-sources/portfolio-standards.php
[vii] https://www.eia.gov/outlooks/aeo/pdf/AEO2020_IIF_Alternative_Policies_FullReport.pdf, page 6
[viii] https://www.eia.gov/energyexplained/renewable-sources/portfolio-standards.php
[ix] https://energyinnovation.org/wp-content/uploads/2020/06/90-Clean-By-2035-Policy-Memo_June-2020.pdf, page 6
[xi] https://openknowledge.worldbank.org/handle/10986/31755, page 15
[xii] State and Trends of Carbon Pricing, 2019, World Bank, Doi: 10.1596/978-1-4648-1435-8, page 15
[xiii] https://www.breakthroughenergy.org/api/playbookbuilder/downloadplaybook?playbookId=f3a80930-3bae-4420-b8e8-2919f466e4f2, page 9
[xiv] https://www.breakthroughenergy.org/api/playbookbuilder/downloadplaybook?playbookId=f3a80930-3bae-4420-b8e8-2919f466e4f2, page 9
[xvi] https://energyinnovation.org/wp-content/uploads/2020/06/90-Clean-By-2035-Policy-Memo_June-2020.pdf, page 12
[xvii] https://emp.lbl.gov/publications/utility-scale-solar-empirical-0
[xviii] https://energyinnovation.org/wp-content/uploads/2020/06/90-Clean-By-2035-Policy-Memo_June-2020.pdf, page 15
[xix] https://www.seia.org/initiatives/solar-investment-tax-credit-itc
[xx] https://www.journals.uchicago.edu/doi/10.1086/649826
[xxi] https://econpapers.repec.org/article/eeejeeman/v_3a65_3ay_3a2013_3ai_3a3_3ap_3a394-410.htm
[xxii] https://energyinnovation.org/wp-content/uploads/2020/06/90-Clean-By-2035-Policy-Memo_June-2020.pdf, page 7